Analytics & Reporting
Analytics & Reporting
BuoyForms provides built-in analytics for every form — no third-party tools needed.
Form Analytics Dashboard
-
1
Open a form from your forms list
Navigate to Forms in the sidebar and click the form you want to analyze. ::
-
2
Click Analytics in the form navigation
The analytics dashboard loads with an overview of your form's performance. ::
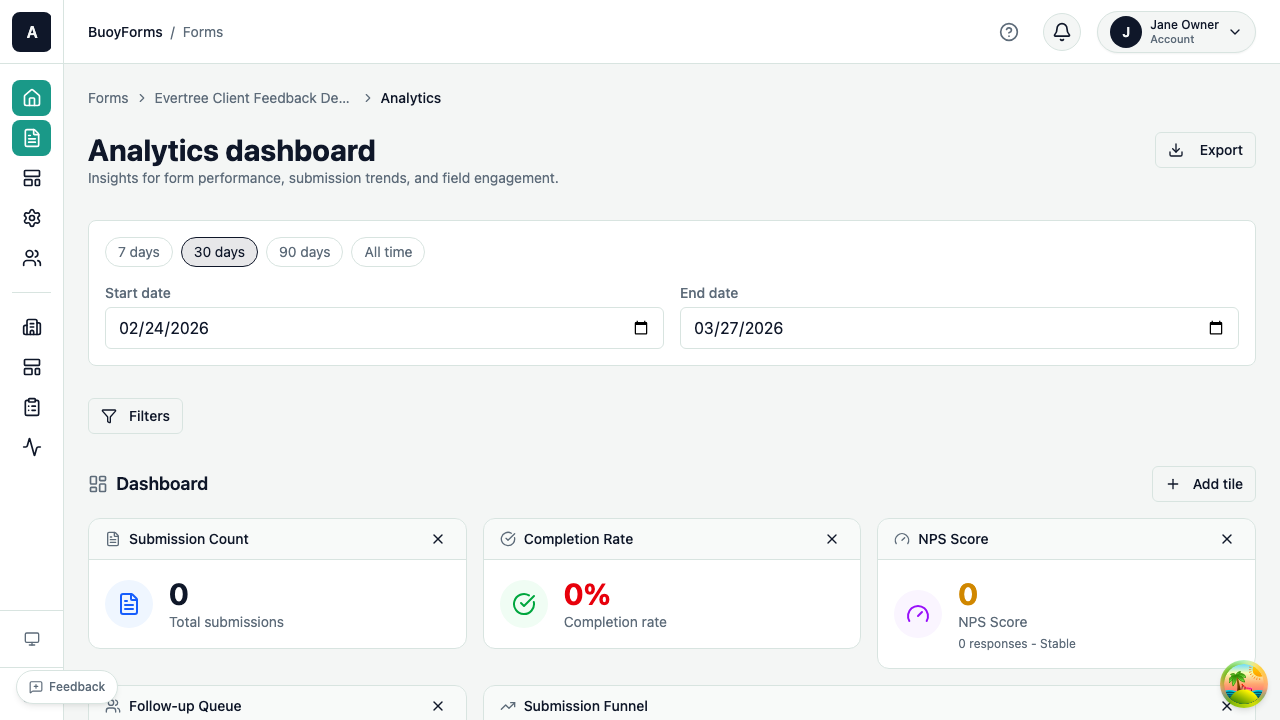
Overview Metrics
| Metric | Description |
|---|---|
| Total Submissions | All-time response count |
| Completion Rate | Percentage of people who started and finished the form |
| Average Completion Time | How long respondents take to complete the form |
| Submissions Over Time | Daily/weekly/monthly trend chart |
Field-Level Analytics
For each field in your form:
- Response distribution — how answers are spread across options (for choice fields)
- Average score — mean value (for rating, NPS, CSAT, CES fields)
- Drop-off rate — what percentage of respondents abandon at this field
NPS Analytics
If your form includes an NPS field, the analytics dashboard shows:
| Metric | Description |
|---|---|
| NPS Score | The calculated Net Promoter Score (-100 to +100) |
| Distribution | How many detractors, passives, and promoters |
| Trend | NPS score over time |
Understanding NPS scoring
NPS is calculated by subtracting the percentage of detractors (0-6) from the percentage of promoters (9-10). Passives (7-8) are not included in the calculation but are shown in the distribution chart. A score above 0 is generally positive, above 50 is excellent, and above 70 is world-class.
CSAT Analytics
For CSAT fields:
- CSAT Score — percentage of satisfied respondents (4 or 5 out of 5)
- Distribution — response breakdown by score
Exporting Data
CSV Export
-
1
Go to Submissions
Open the submissions view for your form. ::
-
2
Click Export
The export dialog opens with format and field options. ::
-
3
Choose CSV
Select CSV as your export format. ::
-
4
Select the date range and fields to include
Narrow the export to exactly the data you need. ::
-
5
Click Download
The CSV file downloads to your computer. ::
Filtered Exports
Apply filters before exporting to get exactly the data you need:
Filter submissions to a specific time period. Useful for weekly or monthly reporting cycles. ::
Filter by specific answers (e.g., NPS score > 8) to export only promoters, detractors, or any segment you define. ::
Include only completed submissions, or also include in-progress responses for a broader dataset. ::
Incomplete Sessions
Track respondents who started but didn't finish your form:
- See which page or field they abandoned on
- Identify friction points in your form
- Access partial submission data (if available)
Webhooks for Real-Time Data
Send submission data to external systems in real time.
-
1
Go to Settings, then Integrations, then Webhooks
Navigate to Settings > Integrations > Webhooks in your form settings. ::
-
2
Click Add Webhook
Start configuring a new webhook endpoint. ::
-
3
Enter the destination URL
Provide the URL where submission data should be sent. ::
-
4
Select which events to send
Choose from
submission.created(when a new response is submitted) andsubmission.updated(when a response is edited). :: -
5
Click Save
The webhook activates immediately for new events. ::
Each webhook delivery includes the full submission data as JSON. Failed deliveries are retried automatically.
Advanced: Retry behavior
Failed webhook deliveries are retried with exponential backoff. BuoyForms attempts up to 5 retries over approximately 24 hours. If all retries fail, the webhook is marked as failed in the delivery log. You can manually retry failed deliveries from the webhook settings page.
Integrations
Map form fields to Salesforce objects. Submissions automatically create or update records in your CRM.
See Integrations for setup instructions. ::
Send submissions directly to a Google Sheets spreadsheet. New rows are added in real time as responses come in. ::
Connect BuoyForms to 5,000+ apps via Zapier. Trigger workflows from new submissions — send Slack notifications, create Trello cards, update HubSpot contacts, and more. ::